

Digital SAT Command of Evidence Questions: Practice Drill #2
Digital SAT Command of Evidence Questions: Practice Drill #2
This practice question will help you master SAT Command of Evidence questions with infographics such as line graphs, tables, or bar charts. Includes detailed answer explanations and a strategy brief!


Greetings, Quiz Hackers! Welcome to this week’s SAT Reading & Writing Command of Evidence practice drill, designed to help you master standard-difficulty Command of Evidence questions involving infographics, such as line graphs, tables, or bar charts.
I've coined a term that I think better describes this question type: Logical Operations: Support (LO:S). Although this LO:S question features a graph, that doesn’t change the basic question type, since we’re still using logic to support a claim.
That said, there are a few key strategies to keep in mind when dealing with infographics. I discuss those below the practice question, where you’ll find a strategy brief and “Key Takeaways” section, along with detailed answer explanations. For the complete details on handling tables and graphs on SAT Reading, dive into Part 2 of my comprehensive strategy guide on SAT Command of Evidence questions.
A premium subscription to Quiz Hacker Test Prep is the “skeleton key” that unlocks success on digital SAT Reading & Writing. As a premium subscriber, you’ll learn all of the powerful strategies I teach my private test prep students, at just a fraction of the cost. Plus, you’ll get the ability to post comments and questions and gain full access to my complete archive of practice questions, answer explanations, and in-depth strategy guides.

Imagine the success you could achieve with these incredible tools at your fingertips! Don’t miss out on this amazing opportunity to achieve your SAT dream score. Start succeeding on the digital SAT now with a premium subscription!
Drill
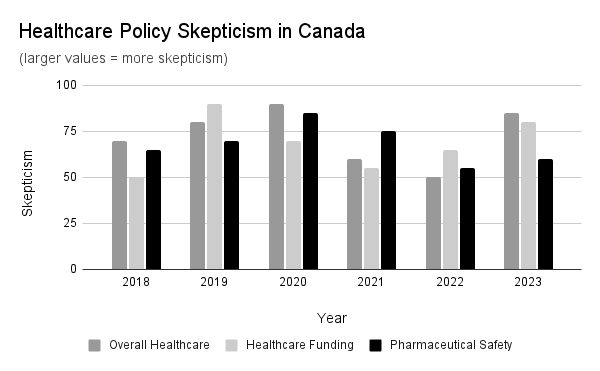
In recent years, public health crises have prompted governments to reassess their health policies. Analysts have turned to social media discussions to quantify public skepticism around health policy, which has been found to impact the public’s healthcare choices. Researcher Aldéric Toussaint studied public sentiment in Canada regarding different aspects of Canadian health policy. The study found that public skepticism regarding overall healthcare policy did not always track with skepticism regarding specific healthcare-related policy areas. This variability is exemplified by Canadian attitudes about healthcare funding policy, which _______
Which choice most effectively uses data from the graph to complete the example?
Keep reading with a 7-day free trial
Subscribe to Walker Prep to keep reading this post and get 7 days of free access to the full post archives.